Function Reference: qncmmvabs
- Function File: [U, R, Q, X] = qncmmvabs (N, S, V)
- Function File: [U, R, Q, X] = qncmmvabs (N, S, V, m)
- Function File: [U, R, Q, X] = qncmmvabs (N, S, V, m, Z)
- Function File: [U, R, Q, X] = qncmmvabs (N, S, V, m, Z, tol)
- Function File: [U, R, Q, X] = qncmmvabs (N, S, V, m, Z, tol, iter_max)
Approximate Mean Value Analysis (MVA) for closed, multiclass queueing networks with service centers and customer classes.
This implementation uses Bard and Schweitzer approximation. It is based on the assumption that the queue length at service center with population set is approximated with
$$Q_k({\bf N}-{\bf 1}_c) \approx {n-1 \over n} Q_k({\bf N})$$
where is a valid population mix, is the population mix with one class customer removed, and is the total number of requests.
This implementation works for networks with infinite server (IS) and single-server nodes only.
INPUTS
-
N(c)
number of class requests in the system (N(c) ≥ 0).
S(c,k) mean service time for class customers at center
(S(c,k) ≥ 0).
V(c,k) average number of visits of class requests to center
(V(c,k) ≥ 0).
m(k) number of servers at center . If m(k) < 1,
then the service center is assumed to be a delay center
(IS). If m(k) == 1, service center is a
regular queueing center (FCFS, LCFS-PR or PS) with a single server
node. If omitted, each service center has a single server. Note
that multiple server nodes are not supported.
Z(c) class external delay (Z ≥ 0). Default is 0.
tol Stopping tolerance (tol>0). The algorithm stops if
the queue length computed on two subsequent iterations are less than
tol. Default is .
iter_max Maximum number of iterations (iter_max>0.
The function aborts if convergenge is not reached within the maximum
number of iterations. Default is 100.
OUTPUTS
-
U(c,k)
If is a FCFS, LCFS-PR or PS node, then U(c,k)
is the utilization of class requests on service center
. If is an IS node, then U(c,k) is the
class at device ,
defined as U(c,k) = X(c)*S(c,k)
R(c,k)response time of class requests at service center .
Q(c,k)average number of class requests at service center .
X(c,k)class throughput at service center .
REFERENCES
- Y. Bard, Some Extensions to Multiclass Queueing Network Analysis, proc. 4th Int. Symp. on Modelling and Performance Evaluation of Computer Systems, Feb 1979, pp. 51–62.
- P. Schweitzer, Approximate Analysis of Multiclass Closed Networks of Queues, Proc. Int. Conf. on Stochastic Control and Optimization, jun 1979, pp. 25–29.
This implementation is based on Edward D. Lazowska, John Zahorjan, G. Scott Graham, and Kenneth C. Sevcik, Quantitative System Performance: Computer System Analysis Using Queueing Network Models, Prentice Hall, 1984. http://www.cs.washington.edu/homes/lazowska/qsp/. In particular, see section 7.4.2.2 ("Approximate Solution Techniques"). This implementation is slightly different from the one described above, as it computes the average response times instead of the residence times.
See also: qncmmva
Example: 1
 S = [ 1, 1, 1, 1; 2, 1, 3, 1; 4, 2, 3, 3 ];
 V = ones(3,4);
 N = [10 5 1];
 m = [1 0 1 1];
 [U R Q X] = qncmmvabs(N,S,V,m);
|
Example: 2
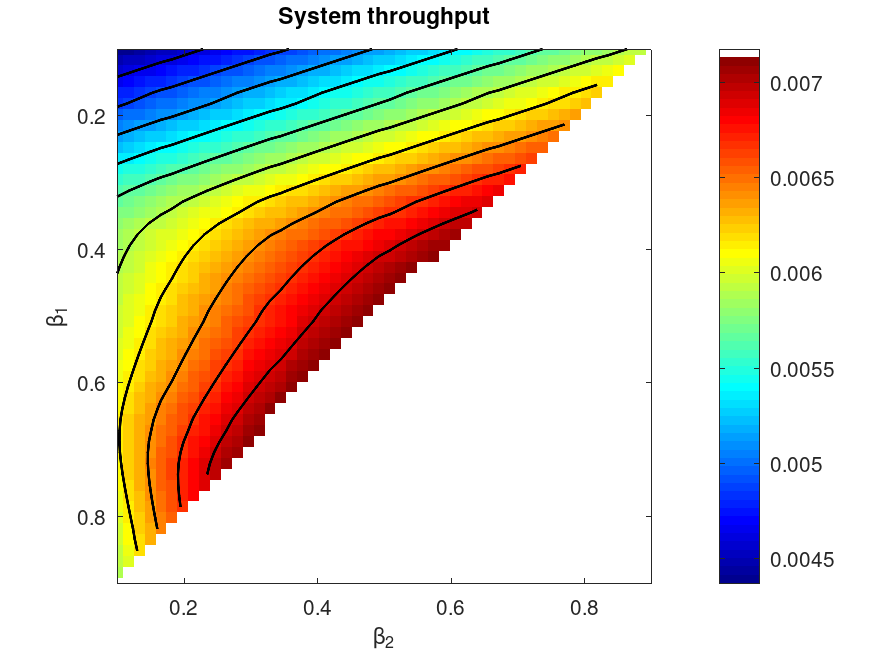
 ## The following code produces Fig. 7 from the paper: M. Marzolla,
 ## "A Software package for Queueing Networks and Markov Chains analysis",
 ## https://doi.org/10.48550/arXiv.2209.04220

 N = 300;                          # total number of jobs
 S = [100 140 200  30  50  20  10; # service demands
      180  10  70  10  90 130  30;
      280 160 150  90  20  50  18];
 Z = [2400 1800 2100];             # mean duration of CPU burst
 V = ones(size(S));                # number of visits
 m = ones(1,columns(S));           # number of servers

 beta = linspace(0.1, 0.9, 50); # population mix
 Xsys = Rsys = NA(length(beta), length(beta));

 pop = zeros(1,rows(S));
 for i=1:length(beta)
   for j=1:length(beta)
     pop(1) = round(beta(i)*N);
     pop(2) = round(beta(j)*N);
     pop(3) = N - pop(1) - pop(2);
     if (all(pop > 0))
       [U R Q X] = qncmmvabs( pop, S, V, m, Z, 1e-5, 1000 );
       X1 = X(1,2) / V(1,2);
       X2 = X(2,2) / V(2,2);
       X3 = X(3,2) / V(3,2);
       Xsys(i,j) = X1 + X2 + X3;
       Rsys(i,j) = N / Xsys(i,j);
     endif
   endfor
 endfor
 minX = min(Xsys(:));
 maxX = max(Xsys(:));
 Xnew = Xsys; Xnew(isna(Xnew)) = maxX+1;
 mycmap = jet;
 mycmap(end,:) = 1; # make the last colormap entry white
 imshow(Xnew, [minX, maxX], "Xdata", beta, "Ydata", beta, "colormap", mycmap);
 colorbar;
 hold on;
 title("System throughput");
 xlabel("\\beta_2");
 ylabel("\\beta_1");
 [XX YY] = meshgrid(beta, beta);
 contour(XX, YY, Xsys, "k", "linewidth", 1.5);
 axis on;
 hold off;
|